Spark

YEAR

2026

CONTEXT

Collaborative

[Collaborative]

KEYWORDS

Public Installation

Emotional Mapping

Collective Storytelling

ROLE

Interaction & Hardware

Design

Fusion, Figma

Systems

Raspberry Pi, Mapbox

Development

VS Code, Firebase

Project Overview

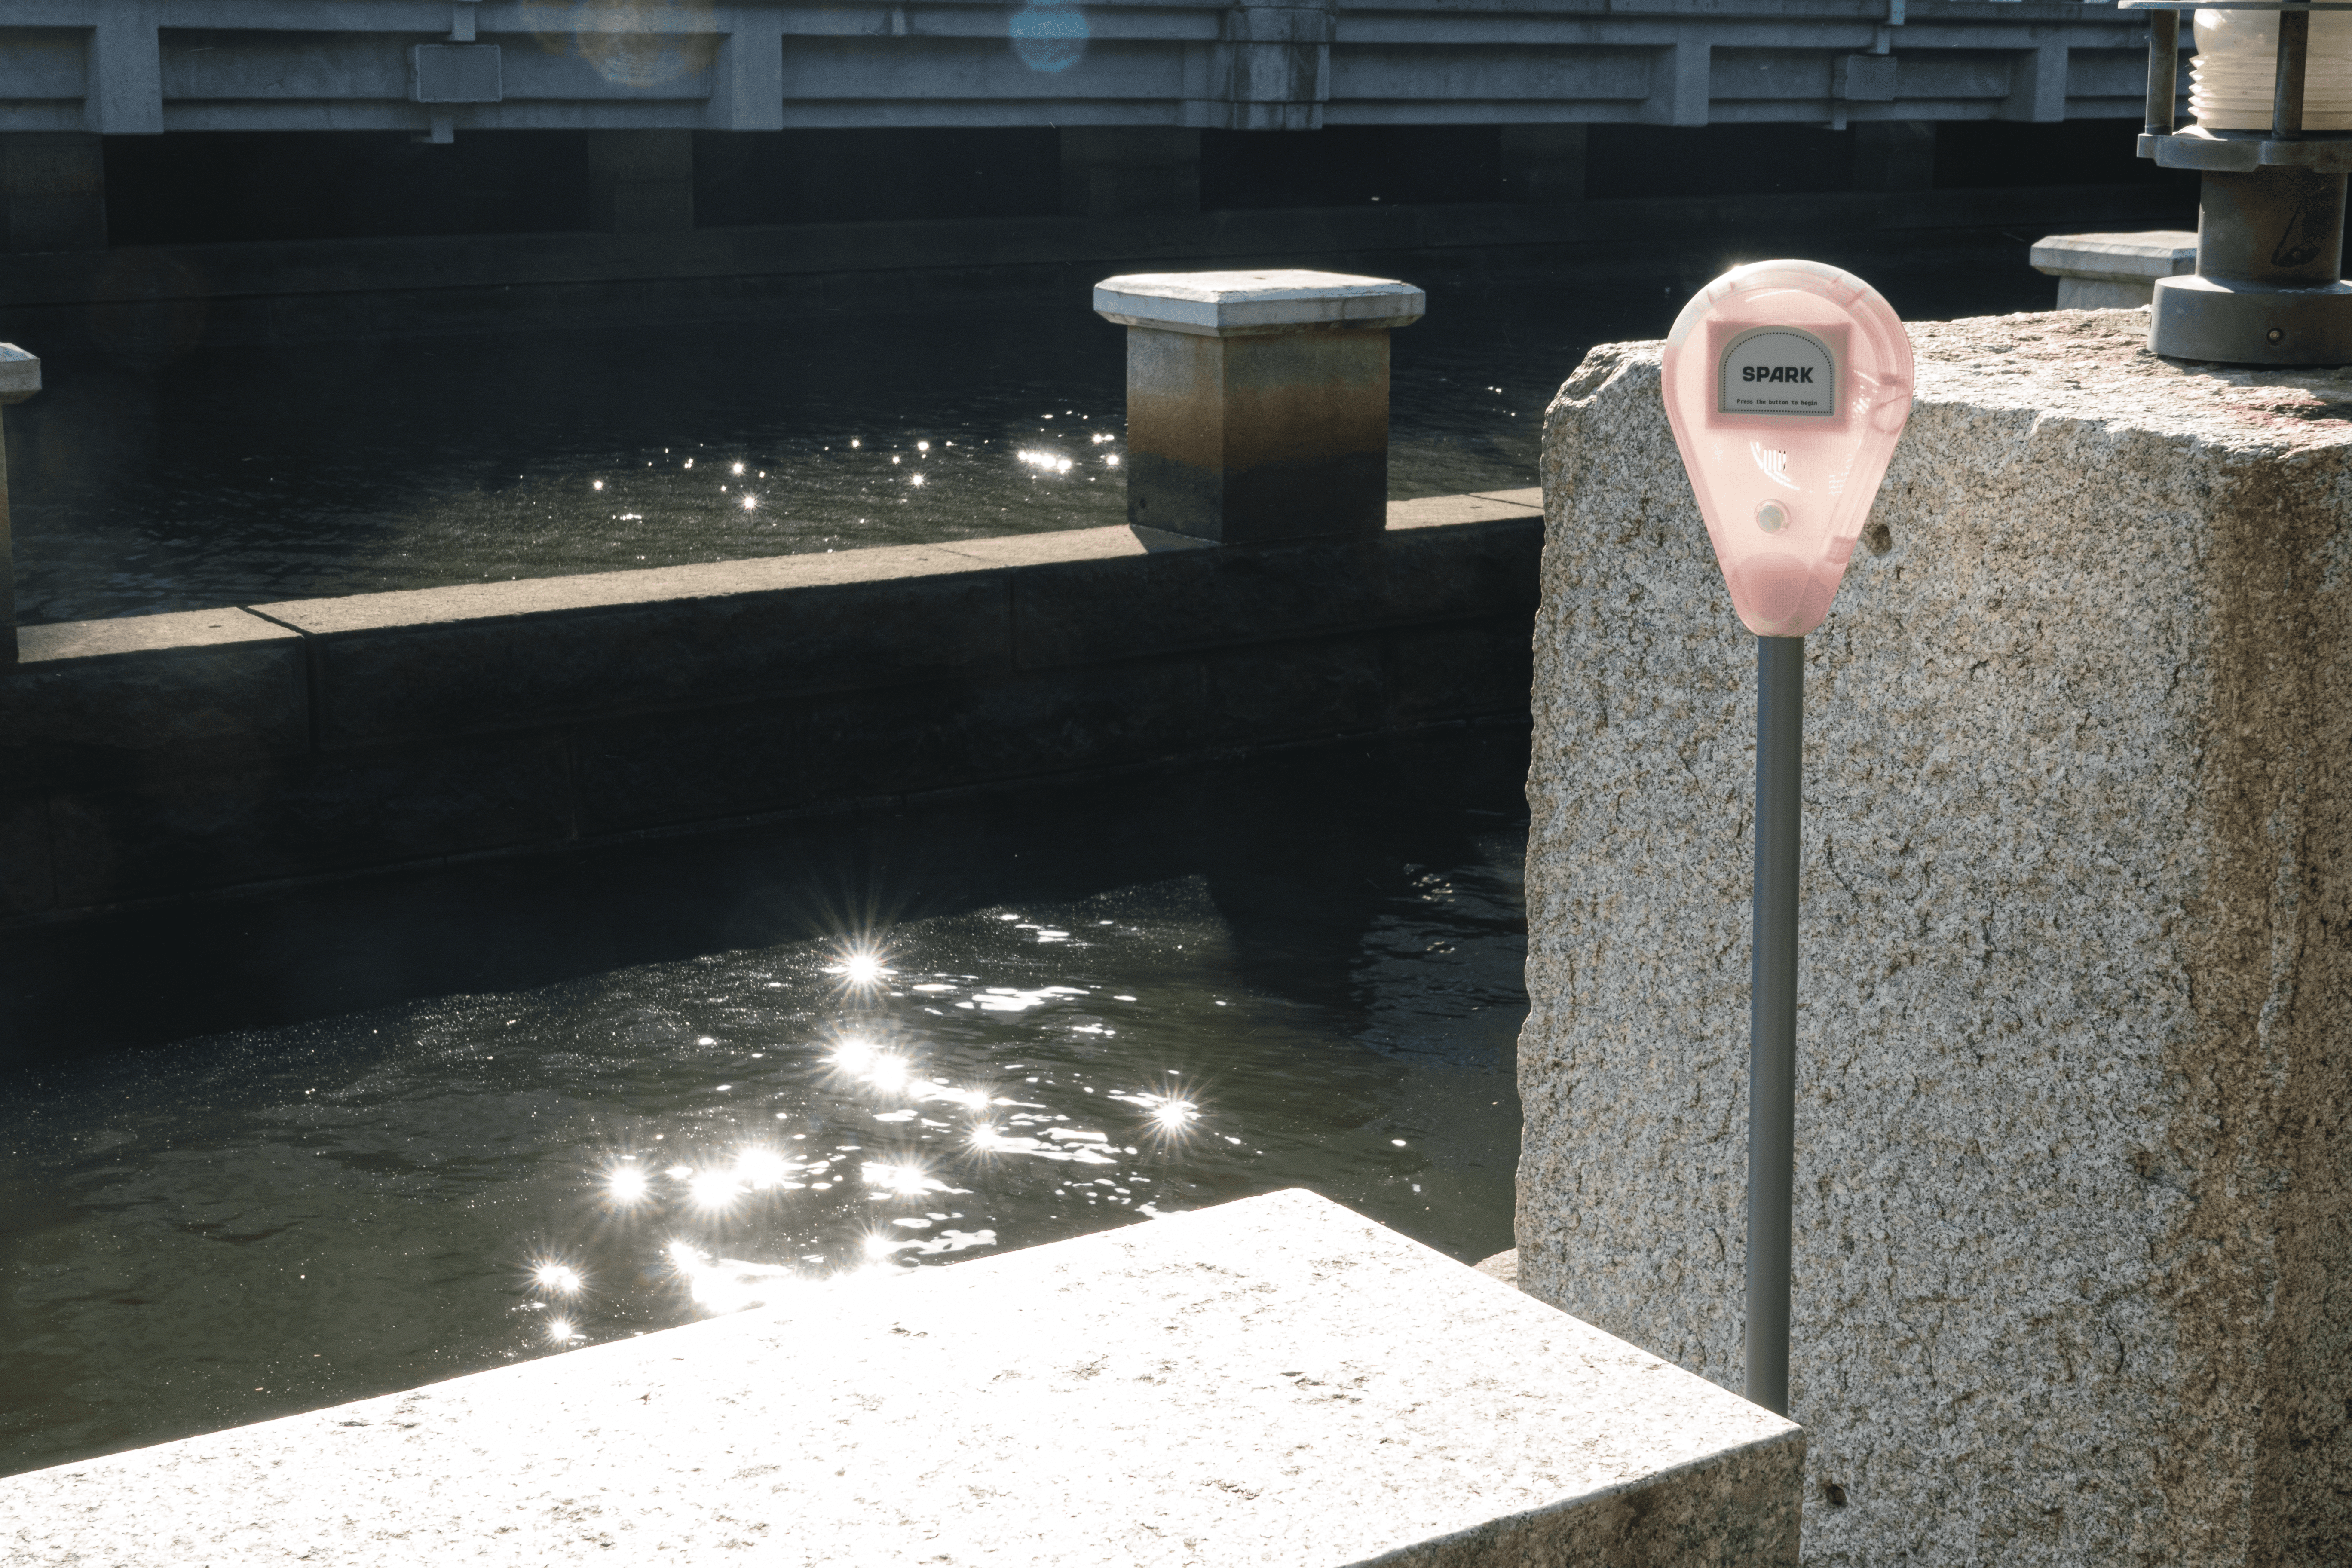
Spark is a location-based interactive installation that invites people to share stories, feelings, and reflections through voice or text. Each contribution is collected by a public device and transformed into a collective “emotional weather” of that place. Through a connected online map, visitors can explore how different locations feel over time, turning personal traces into a shared portrait of public emotion.
EExxpplloorree  SSppaarrkk  WWeebbssiittee

Problem


Public spaces are physically shared, but they rarely make room for emotional connection. People pass through the same streets, parks, campuses, and buildings every day, yet most interactions remain practical, brief, or invisible.

Cities often measure public space through movement, safety, density, and function, but they rarely capture how people actually feel in those places. As a result, the emotional atmosphere of a location — its memories, tensions, comfort, loneliness, joy, or sense of belonging — often goes unrecorded and unshared.

Research

These references helped us see public space as a place shaped by small interactions, shared trust, and collective participation. Spark responds to this by transforming public data collection into a more human and poetic experience, where individual feelings become part of a larger emotional map of the city.

LITERATURE

insights

Public data collection is boring, heartless, and limited in scope.

Public art brings people together.

Collaborative public art is a catalyst for social involvement.

Abreu, José Guilherme. (2017). Public Art as a Means of Social Interaction: From Civic Participation to Community Involvement.

Sketches & Prototypes


User Tests


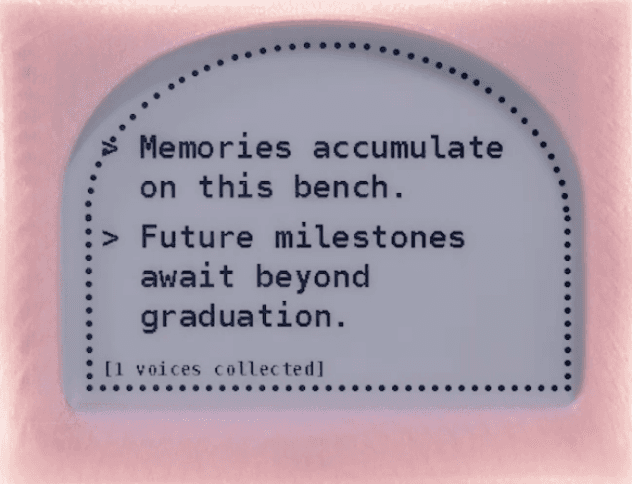
I iterated the installation interface through user feedback to make the interaction clearer, more visible, and easier to follow in public space. Early screens were too minimal, so people were unsure how long they had to speak, whether the system was listening, or whether an output would appear. In response, I enlarged the text, added clearer visual cues during recording, included a processing screen to show that a response was being generated, and displayed the number of voices collected to make the shared nature of the system more visible. I also redesigned the screen layout to follow the curved shape of the shell, making the interface feel more integrated with the physical object. The final opening page introduces the Spark logo and a simple call to action, helping the installation attract attention while guiding people into the interaction step by step.

interface

design Outcome

The interactive map I created connects each Spark installation to its physical location in the city. Every marker represents a live installation site and displays the emotional weather generated from voices collected there. The map syncs with the actual installation every five seconds, updating the latest output and the number of voices collected in real time. As more Spark objects are placed across different public spaces, these location-based outputs come together to form a live emotional weather map of the city.

interactive map

project website


Future directions

In the future, Spark could expand from a single installation into a network of emotional weather stations across parks, campuses, galleries, neighborhoods, and cities. By placing Spark in multiple locations, the project could create a living emotional map that shows how people feel in different public spaces over time. It could also support community listening, public feedback, local media storytelling, and mental wellness by giving people a softer, more poetic way to share feelings that might otherwise go unspoken.

BBAACCKK  TTOO  WWOORRKKSS